1/6
Candlestick Chart Patterns Technical Analysis screenshot 0
Candlestick Chart Patterns Technical Analysis screenshot 1
Candlestick Chart Patterns Technical Analysis screenshot 2
Candlestick Chart Patterns Technical Analysis screenshot 3
Candlestick Chart Patterns Technical Analysis screenshot 4
Candlestick Chart Patterns Technical Analysis screenshot 5
Candlestick Chart Patterns Technical Analysis Icon

Candlestick Chart Patterns Technical Analysis

Option Strategy App
Trustable Ranking IconTin cậy
1K+Tải về
3MBKích thước
Android Version Icon4.3.x+
Phiên bản Android
1.0(20-09-2018)Phiên bản mới nhất
-
(0 Đánh giá)
Age ratingPEGI-3
Tải về
Chi tiếtĐánh giáPhiên bảnthông tin
1/6

Mô tả của Candlestick Chart Patterns Technical Analysis

Candlesticks are graphical representations of price movements for a given period of time. They are commonly formed by the opening, high, low, and closing prices of a financial instrument.


If the opening price is above the closing price then a filled (normally red or black) candlestick is drawn.


If the closing price is above the opening price, then normally a green or a hollow candlestick (white with black outline) is shown.


The filled or hollow portion of the candle is known as the body or real body, and can be long, normal, or short depending on its proportion to the lines above or below it.


The lines above and below, known as shadows, tails, or wicks represent the high and low price ranges within a specified time period. However, not all candlesticks have shadows.


Candlestick patterns are widely used in technical analysis.


Big Black Candle


Big White Candle


Black Body


Doji


Dragonfly Doji


Gravestone Doji


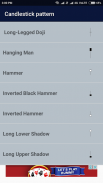
Long-Legged Doji


Hanging Man


Hammer


Inverted Black Hammer


Inverted Hammer


Long Lower Shadow


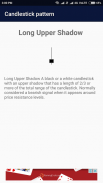
Long Upper Shadow


Marubozu


Shooting Star


Spinning Top


White Body


Shaven Bottom


Shaven Head


Bearish Harami


Bearish Harami Cross


Bearish 3-Method Formation


Bullish 3-Method Formation


Bullish Harami


Bullish Harami Cross


Dark Cloud Cover


Engulfing Bearish Line


Engulfing Bullish


Evening Doji Star


Evening Star


Falling Window


Morning Doji Star


Morning Star


On Neckline


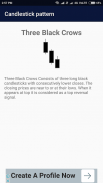
Three Black Crows


Three White Soldiers


Tweezer Bottoms


Tweezer Tops


Doji Star


Piercing Line


Rising Window

Candlestick Chart Patterns Technical Analysis - Phiên bản 1.0

(20-09-2018)
Phiên bản khác
Có gì mớiCandlestick charts

Không có đánh giá hoặc xếp hạng nào! Để rời khỏi trang đầu tiên, vui lòng

-
0 Reviews
5
4
3
2
1

Candlestick Chart Patterns Technical Analysis - Thông tin APK

Phiên bản APK: 1.0Gói: com.oti.ip.candlestick
Khả năng tương thích với Android: 4.3.x+ (Jelly Bean)
Lập trình viên:Option Strategy AppGiấy phép:4
Tên: Candlestick Chart Patterns Technical AnalysisKích thước: 3 MBTải về: 76Phiên bản: : 1.0Ngày phát hành: 2020-12-03 18:35:07Màn hình tối thiểu: SMALLCPU được hỗ trợ:
ID gói: com.oti.ip.candlestickChữ ký SHA1: 02:A0:D1:AF:2D:EE:FC:93:80:60:F6:9B:4E:99:FB:C7:43:5C:D9:4DLập trình viên (CN): Tổ chức (O): optimisticitĐịa phương (L): Quốc gia (C): Bang / Thành phố (ST): ID gói: com.oti.ip.candlestickChữ ký SHA1: 02:A0:D1:AF:2D:EE:FC:93:80:60:F6:9B:4E:99:FB:C7:43:5C:D9:4DLập trình viên (CN): Tổ chức (O): optimisticitĐịa phương (L): Quốc gia (C): Bang / Thành phố (ST):

Phiên bản mới nhất của Candlestick Chart Patterns Technical Analysis

1.0Trust Icon Versions
20/9/2018
76 tải về3 MB Kích thước
Tải về
appcoins-gift
Trò chơi AppCoinsGiành thêm nhiều phần thưởng hơn nữa!
thêm